It’s almost become a rule that you’ll find a “system EQ” patched between the main L/R outputs of a mixing console and the subsequent stage of a PA system. Even in cases where digital mixers already incorporate onboard “patchable” software EQ, many system designers provide an outboard hardware EQ to facilitate quick and easy adjustments, especially in festival situations where not all engineers may be familiar with a particular desk.
In the past, the 31-band stereo graphic EQ was used as much to correct deficiencies in our gear as it was to address room acoustics, but live sound equipment has ascended to a level where the gear is really good, and now we’re more concerned with problems caused by interaction between the PA and the environment (i.e., the room). EQ is really the final frontier — before grabbing those sliders (real or virtual), you must ensure that a PA system is properly designed, built and arrayed, that every component is working as it should, that no drivers are blown and that all devices are phase-coherent; the aforementioned are all problems that EQ cannot fix.
The Graphic EQ
A graphic equalizer is called such because once you’ve finished making adjustments, the front panel displays the EQ modifications you have applied to the PA system. It does not display the resulting frequency response of the system. Graphic EQs have sliders for boosting and cutting many frequencies, and these frequencies are fixed. The typical professional graphic EQ is referred to as “31-band, third-octave.” This means that the unit provides adjustment for 31 different frequencies across the audio range, spaced one-third of an octave apart.
A 31-band graphic EQ usually has adjustments at 20, 25, 31.5, 40, 50, 63, 80, 100, 125, 160, 200, 250, 315, 400, 500, 630 and 800Hz and 1, 1.25, 1.6, 2, 2.5, 3.15, 4, 5, 6.3, 8, 10, 12.5, 16 and 20kHz. These frequencies — which have been recognized by the International Standards Organization (ISO) — are sometimes referred to as “center” frequencies or “ISO frequencies” [Note: The one-third-octave concept was pioneered by SynAudCon founder Don Davis. The main idea behind one-third-octave spacing was that the human ear could not resolve changes of finer resolution].
Boost and cut ranges on the bands of graphic equalizers are usually plus or minus 12 dB. Many units have a “range” button that shifts the maximum boost or cut from ±12 dB to ±6 dB so that finer adjustments can be made if necessary. Bandwidth — the range of frequencies surrounding the center frequency — is fixed. Graphic EQs intended for consumer use may have as few as five bands, while semi-pro graphic equalizers may have 10 bands, in what is known as octave-band arrangement. Pro applications require a higher level of resolution (and more knobs to impress the audience) — thus the need for 31-bands.
Graphic equalizers are easy to use and span a wide range of frequencies. The high number of bands and their dedicated sliders make it easy to quickly locate and grab a problem frequency. The user interface is familiar, and you can see the response modification by looking at the front panel. A disadvantage of using a graphic EQ is that, at times, you will need to access a frequency that lies in between two standard ISO centers. Does that make you SOL (that’s Surely Outta Luck)? It depends upon the design of the EQ.
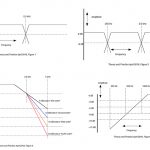
Each band of an EQ can be referred to as a “filter.” For the record, I hate that label. Filters remove something, so how can an EQ filter boost a frequency? Jumbo shrimp anyone? Anyway, the filters in a graphic EQ are either combining or non-combining. Combining filters have a smoother transition from band to band, making it easier to grab, or massage, a frequency between two ISO frequencies without need for excessive boost or cut. If the filters are non-combining, then boosting two neighboring bands will still result in a dip between them — which means you may not be able to grab that in-between frequency. This is a more modern, somewhat surgical approach. And that is the main disadvantage of a graphic EQ: you don’t have the ability to “tune” the filter to access a frequency that’s in between the ISO centers. Enter the parametric EQ.
The Parametric EQ
A parametric equalizer offers control over the amount of boost or cut, plus it lets the user “sweep” the center frequency, tuning it to any frequency that’s required. In practice, there may be some limitations. For example, a midrange band may sweep from 500 Hz to 5,000 Hz. Parametric EQ also provides the ability to alter how narrow or broad the filter is. This bandwidth is often referred to as “Q” — the higher Q, the sharper the filter curve. By setting bandwidth very narrow, you can correct a small slice of audio while disturbing a minimum of neighboring frequencies. The disadvantage of a parametric equalizer is that it’s a little more difficult to use, and most units provide fewer bands than a graphic EQ. Given the state of the live sound art, four or five parametric bands per channel may be more than sufficient.
EQ and System Tuning
PA systems can be tuned in a variety of manners, one of which is Real Time Analysis. RTA can be performed with dedicated hardware units (which are going the way of the dinosaur) or using software such as Smaart or SpectraFoo. Pink noise (a random noise test signal that’s shaped to provide equal intensities of sound in each octave band) is played though the PA while a measurement microphone of known response listens. The RTA analyzes the data and displays a frequency response of the system, usually in third-octave bands that correspond to the ISO frequencies. So, in theory, if you run RTA on a system and see a 6dB peak at 100 Hz, you find 100 Hz on your graphic EQ, pull it down, ét voilå (!) the problem, she is fixed. Yeah, if only. Poor room acoustics are difficult to fix completely, but our equalizers can at least reduce the problems.
The real home run is to have both types of EQ available: graphic for expedience and parametric for accuracy. Way in the past, a rare beast called the paragraphic equalizer roamed the earth. It was an EQ that combined the multiband capability of a graphic with the tune-ability of a parametric. You have a better chance of seeing a jackalope in Brooklyn than finding a pro hardware paragraphic EQ these days (though the Waves Q10 delivers these functions in a plug-in format). Tuning a room using RTA and pink noise can help flatten the response curve, but that doesn’t mean it’s going to sound pleasing. You may do just as well by ear. Quick side note: if you’re on a festival bill and can’t make adjustments before your at-bat, it may be helpful to run RTA, if only for the purpose of getting a look at the response of the system by listening to music between acts.
Other engineers tune by ear using familiar music or the sound of their own voice. Regardless of the source, one technique is going through the bands of a graphic EQ, boosting each in turn to emphasize what you don’t want, and then cutting it. This is probably a better practice than boosting what you want more of, because you may run into a situation where (for any number of reasons) you can’t hear what you’re trying to boost, and you blow up a power amp or speaker trying to make it audible. This is the reason that the graphic EQ on a Yamaha PM5D can be switched to boost or cut by 6, 12 or 15 dB, but the 24 dB mode is cut-only. I usually go through the EQ band by band, slowly boosting each one while listening to the results.
When I hear something I don’t like, I apply a cut. Depending upon the system, cutting certain bands in the lower mids (160 to 800 Hz) may reduce muddiness that stems from room resonance. Ditto for the frequencies from 1 kHz to 4 kHz and vocal harshness that might occur due to hard, reflective surfaces, or perhaps older speaker cabinets that have an edge in the upper-mids (the regions of 1.6, 3.15, 4 or 6.3kHz are always suspect).
In cases where a digital console provides the option of either graphic or parametric EQ on the L/R bus, you may find that judicious use of three or four parametric bands is ultimately more effective than a 31-band EQ. It’s all about your chops. Other tuning techniques include significant boost in the bottom end to get the audience’s pants flapping, or intentionally rolling low frequencies out of the PA to compensate for rooms that boom in the bottom, or PAs that are underpowered.
At this point it’s worth a mention that both graphic and parametric EQs are eminently useful tools for tuning monitor rigs, especially when attempting to increase gain-before-feedback. We’ll explore that in the not-too-distant future.


