One of the most familiar audio analysis tools for live sound is Real Time Analysis (RTA), also known as spectrum analysis. Many of us are familiar with the process. One reproduces a known signal from a tone generator (typically pink noise), sends it through a PA system and uses a measurement microphone to capture the sound. The RTA displays the manner in which the audio signal has been changed on a graph showing frequency versus amplitude. You then adjust EQ in an effort to ‘flatten’ the curve, thus ‘fixing’ the problem.
In theory, this procedure compensates for frequency response anomalies in the PA system, but — as has often been said — theory is not practice, and that’s why we’re here in the first place. RTA has several fundamental limitations that require you to do extra homework. Some engineers feel that 1/3-octave resolution is not detailed enough, but that’s what most of us use because our graphic EQs are generally 1/3-octave, and the ISO center frequencies on the RTA match those of the EQ. Third-octave adjustments can help improve overall system tone quality, but don’t really solve major problems. A case could be made that 1/6-octave analysis would be more accurate, with complementary corrections coming from a parametric EQ to overcome the gaps present in between the bands of a typical 31-band graph. (In the future we’ll look at other measurement techniques such as FFT, which measures frequency vs. amplitude vs. time).
RTA is probably more effective for making electrical measurements as opposed to acoustic measurements. Unlike an electrical measurement, any acoustic measurement is influenced by the environment, thus messing with the time coherence. In other words, sounds reaching the listener’s ears don’t necessarily arrive at the same time. Much like Bumbles, sound waves bounce. Once they leave the speaker cabinet, sound waves might reflect from a wall or ceiling before reaching the listening position — a fact which, of itself, is not a tragedy. But when that wave is combined with the sound that reaches the listener sans reflection (i.e., the direct sound from the speaker), we have a real problem. The direct and reflected sounds arrive at the listener at different times, resulting in what some call “time smear” or phase incoherence. As PA system volume is increased, this problem gets worse, due to the fact that the reflections become stronger than they’d be if the PA were playing at a soft level. Unfortunately, RTA does not see (or perhaps “hear” is the correct word) this time smear.
Furthermore there are issues with loudspeaker coverage. In a perfect world, output from multiple loudspeakers would not overlap, and a listener would hear only one loudspeaker from the array (or two for a stereo system). Each listener would be out of the coverage field of loudspeakers not intended to reach them. However, in the real world, that ain’t so. The dispersion patterns of loudspeakers inevitably spill into each other, causing phase cancellation and more “smear.” These are not issues that RTA can correct, because they are not problems of the frequency domain. Improper speaker deployment or lousy acoustics cannot be fixed using electronic means.
» Identifying Problems EQ Can’t Fix
So how do we take advantage of RTA and use it to meaningfully interpret the state of our sound system? For starters, we want to make multiple measurements from various locations in the room and either print out the results or store the curves for comparison.
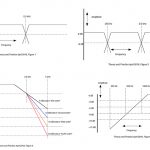
Let’s suppose you shoot the room and get a result that looks like Fig. 1, a 1/3-octave RTA display made using Rational Acoustics’ Smaart 7.4.2. We can see that there are pretty severe notches in the frequency response at 63 and 125 Hz. On the surface, it would appear that we simply need to find those frequencies on our graphic EQ and boost them a few dB to flatten out the curve. But the real question is: Why is there a notch at these frequencies? This notch could be the result of several things: a blown driver, phase cancellation between two cabinets that are not properly arrayed, faulty crossover, or maybe the room itself has a resonant mode at that frequency. Or worse: you might be asking the PA system to produce energy it is not capable of producing. We can’t simply assume that moving an EQ slider will fix the problem, but the information is useful nonetheless.
Let’s examine these issues one at a time.
Blown drivers are relatively easy to troubleshoot. Play pink noise at a low level and get your ear close to each driver. Make sure it is producing sound. Pink noise may not reveal a marginal driver, such as one that has a voice coil rubbing, or perhaps a surround that is breaking down. Complete the test with a sine wave sweep from 20 Hz up to 16 kHz and listen for distortion or rattles.
The loudspeakers are not properly arrayed. In an ideal world, one speaker covers one area without spilling into another area. If you measure an area where there is a lot of spill, you’ll be attempting to fix problems that don’t necessarily exist elsewhere. Possibilities for the source of such problems include incorrect choice of cabinet/coverage pattern, poor orientation of height or angle of the speaker relative to the listening position or — in the case of multi speaker arrays — perhaps the individual cabinets are not deployed as the manufacturer intended, resulting in coverage holes or overlap.
Moving the measurement mic around while performing RTA can reveal room resonant modes. Listen (and watch) for room locations where certain frequencies either disappear (nodes) or become very loud (antinodes). Use pink noise and low-frequency sine waves to expose these issues. The good news is that nodes and antinodes are easy to hear and see using RTA. The bad news is that corrective room treatment — such as absorptive panels for high/mid-frequency problems and bass traps for low frequency issues —can be relatively expensive solutions.
Beware of asking a PA to do something it was not intended to do. For example, if you notice that the system’s LF response rolls off at 100 Hz, there may be absolutely nothing wrong with the system. It could be that the boxes simply were not built to reproduce anything below 100 Hz, or that there is a misadjustment in a crossover or high-pass filter preventing the reproduction of such frequencies.
» What To Do Next?
After evaluating the above possibilities, you can ascertain whether or not applying EQ will help fix the issues that have been exposed. Certainly you want to compare measurements taken throughout the room and see if frequency response varies considerably with location (it inevitably does). Once that has been done, formulate a plan for applying the corrective EQ. Will you apply one graphic EQ on the output bus of the console and hope that by EQing the L/R bus, will fix the frequency response of every speaker in the room? Or will you try to EQ the room in “zones” so you can take a more surgical approach? The latter case will be more accurate, but increases the complexity of the system, because you’ll need more graphic or parametric EQs (whether hardware or software), and they’ll be patched before the amp(s) feeding a particular zone. It is in these situations that the advantages of powered speakers with onboard processing become evident, because you can apply EQ per cabinet, providing much more precise control over the outcome of your efforts.
Don’t forget that the ultimate fine-tuning of the system comes from the most important measurement tool in the world: Your ears!


